Forecast Fire Danger Bias
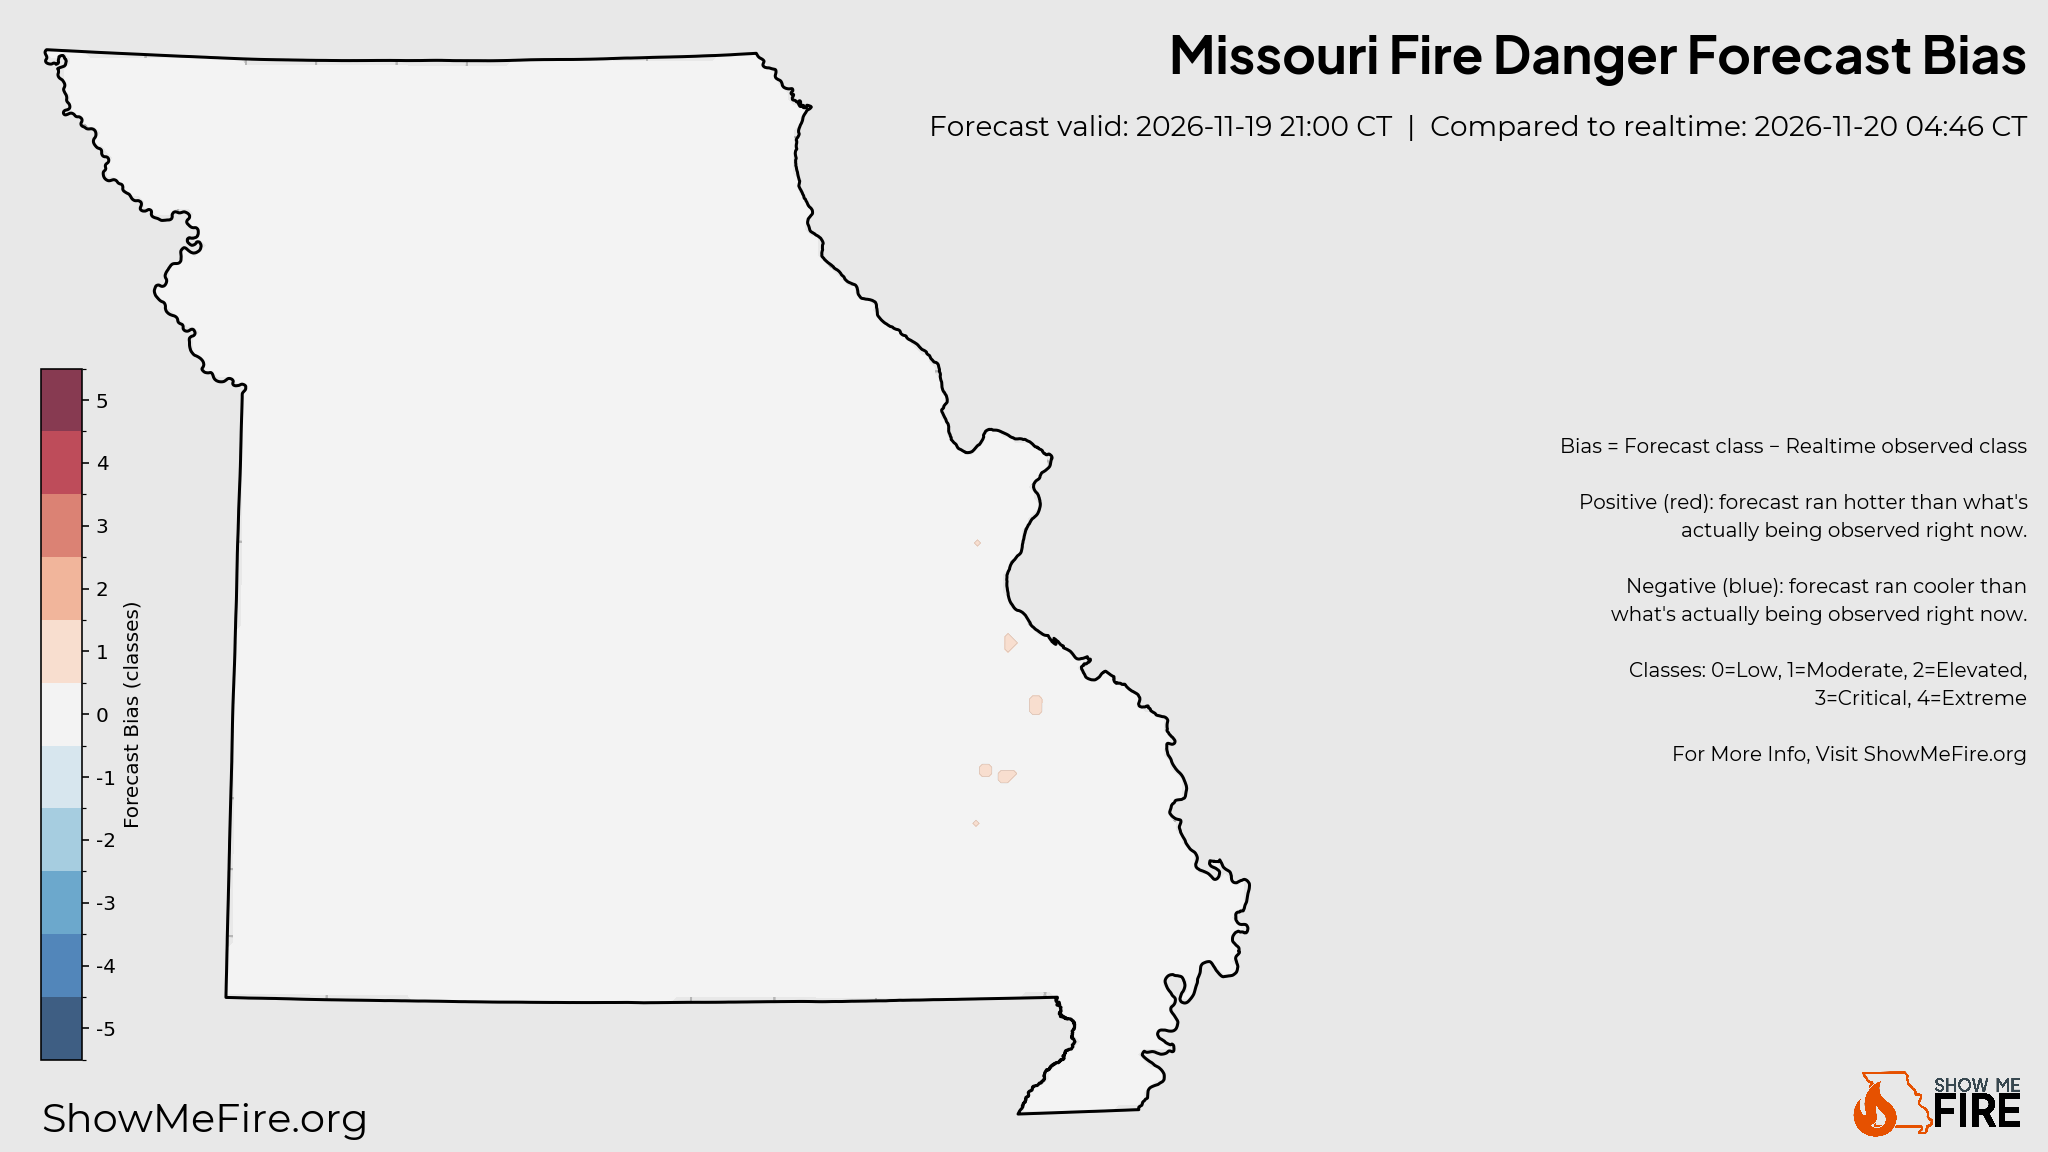
Where the current fire-danger forecast is running hotter or cooler than what's actually being observed right now, updated every 15 minutes.
What is being compared?
The forecast fire-danger class for the hour closest to right now vs. the realtime fire-danger class built from live station observations, cell by cell across Missouri.
How should I read it?
Red means the forecast predicted a higher danger class than is currently being observed. Blue means it predicted lower. White means they agree.
Looking for daily accuracy?
This map is a live intraday snapshot. For how the forecast compared to the full day's observed peak, see Forecast Performance.
Tap the image to view full-size